from pathlib import Path
from plotnine import ggplot, aes, geom_histogram, geom_vline
from faicons import icon_svg
from palmerpenguins import load_penguins
from shiny import reactive
from shiny.express import input, render, ui

df = load_penguins()
app_dir = Path(__file__).parent

ui.page_opts(title="Penguins histogram", fillable=True)

with ui.sidebar(title="Filter controls"):
    ui.input_checkbox_group(
        "species",
        "Species",
        ["Adelie", "Gentoo", "Chinstrap"],
        selected=["Adelie", "Gentoo", "Chinstrap"],
    )
    ui.input_checkbox_group(
        "island",
        "Island",
        ["Biscoe", "Dream", "Torgersen"],
        selected=["Biscoe", "Dream", "Torgersen"],
    )

with ui.layout_column_wrap(fill=False):
    with ui.value_box(showcase=icon_svg("earlybirds")):
        "Number of penguins"

        @render.text
        def count():
            return filtered_df().shape[0]

    with ui.value_box(showcase=icon_svg("ruler-horizontal")):
        "Average bill length"

        @render.text
        def bill_length():
            return f"{filtered_df()['bill_length_mm'].mean():.1f} mm"

    with ui.value_box(showcase=icon_svg("ruler-vertical")):
        "Average bill depth"

        @render.text
        def bill_depth():
            return f"{filtered_df()['bill_depth_mm'].mean():.1f} mm"


with ui.layout_columns():
    with ui.card(full_screen=True):
        ui.card_header("Bill length")

        @render.plot
        def length():
            return (
                ggplot(filtered_df(), aes(x="bill_length_mm"))
                + geom_histogram()
                + geom_vline(
                    xintercept=filtered_df()["bill_length_mm"].mean(),
                    color="green",
                    linetype="dashed",
                )
            )


@reactive.calc
def filtered_df():
    filt_df = df[df["species"].isin(input.species())]
    filt_df = filt_df[filt_df["island"].isin(input.island())]
    return filt_df
1 ペンギンのヒストグラムのダッシュボードをShiny for Pythonでつくる
下記のShiny Expressのコードをapp.pyとして保存する。
下記をターミナル/コマンドプロンプトで実行するとブラウザで下図のようなダッシュボードが出てくる。
python3 -m shiny run --launch-browser app.py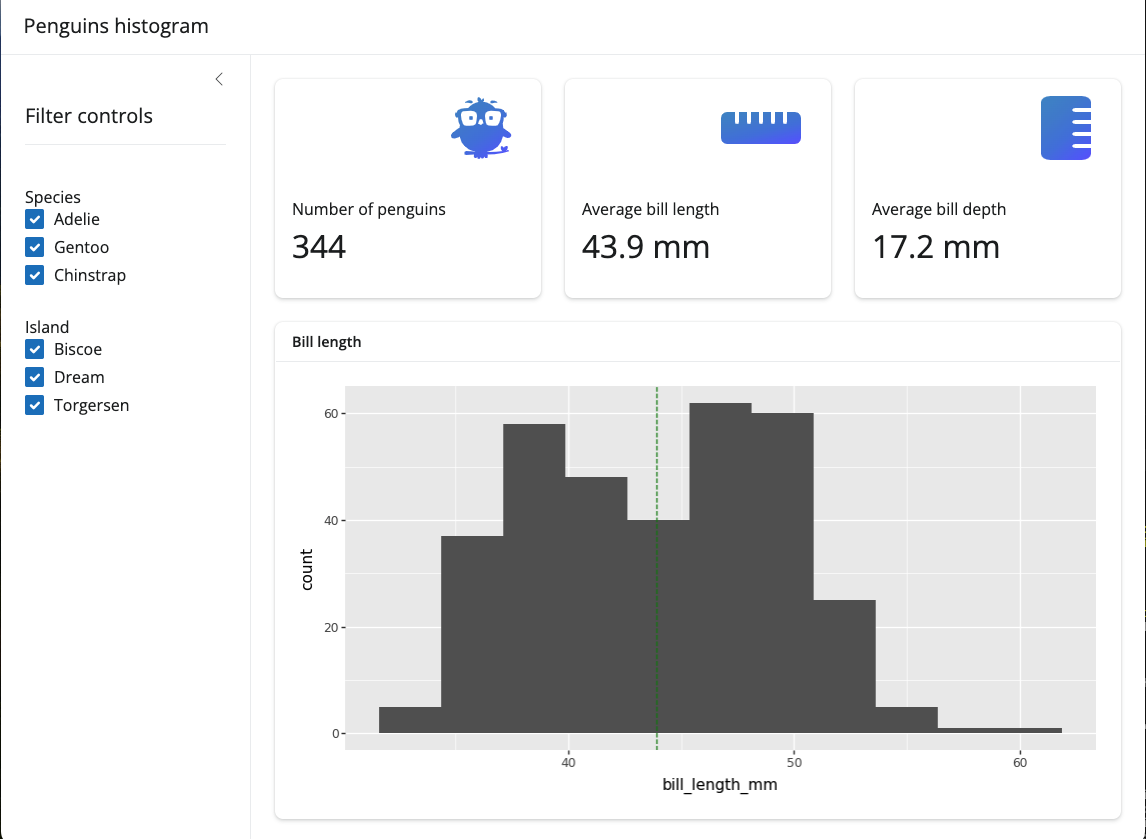
2 shinyを実行ファイル化する(Mac OS)
下記のShiny Coreのコードをfile1.pyとして保存する。
from shiny import App, render, ui
from shiny._main import run_app

app_ui = ui.page_fluid(
    ui.h2("Hello Shiny!"),
    ui.input_slider("n", "N", 0, 100, 20),
    ui.output_text_verbatim("txt"),
)
def server(input, output, session):
    @output
    @render.text
    def txt():
        return f"n*2 is {input.n() * 2}"
app = App(app_ui, server)
run_app(app,launch_browser=True)
Macのターミナルでfile1.pyがあるフォルダにカレントディレクトリを移動してから下記を実行する
python3.13 -m venv .venv
source .venv/bin/activate
pip install pyinstaller shiny
pyinstaller -F --collect-all shiny --name file1_app2 file1.py
しばらく待つとdist/file1_app2が作成されるのでダブルクリックして実行する。すると下図の画面が出てアプリの起動が完了。
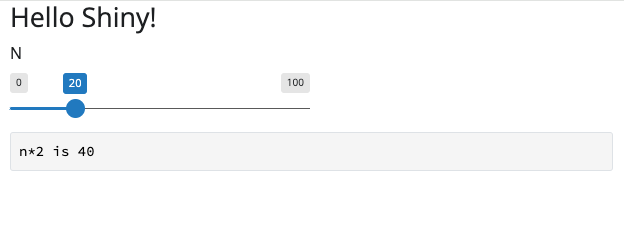
アプリの終了時はブラウザを閉じ、ターミナルでCtrl+Cを押してから閉じる。
なおShiny Expressのコードから実行ファイルをつくる方法があるのかは不明。
3 参考文献
4 Python version
import platform
"Python version "+platform.python_version()
'Python version 3.13.3'