import polars as pl
import numpy as np
import plotly.express as px
n = 1000000
s = np.random.normal(0, 1, n)
h = np.random.normal(0, 1, n)
df = pl.DataFrame({"value": s, "h": h}).with_columns(
pl.when(pl.col("h") > 0)
.then(pl.lit("high"))
.otherwise(pl.lit("low"))
.alias("high_low"),
pl.lit(0.5).alias("a"),
).to_pandas()
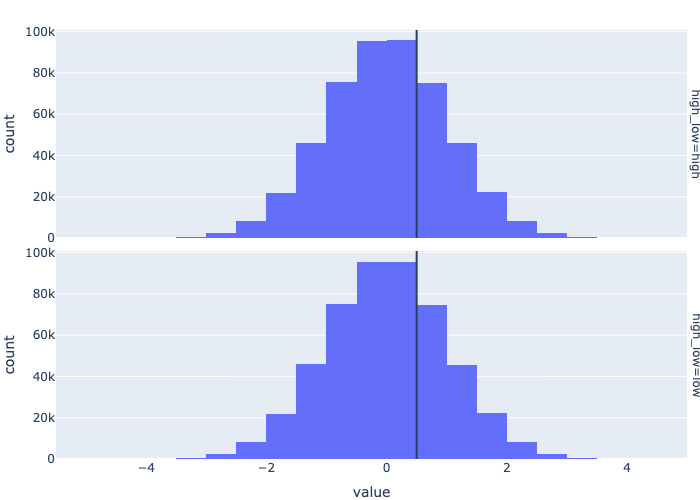
fig=px.histogram(df,x="value",nbins=32,facet_row="high_low")
fig.add_vline(x=0.5)
fig.write_image("altair_histogram_trial18.png")
1 ヒストグラム
保存したファイルを表示する
2 参考文献
3 Python version
import platform
"Python version "+platform.python_version()
'Python version 3.12.3'