library(ggplot2)
library(ggExtra)
data("iris")
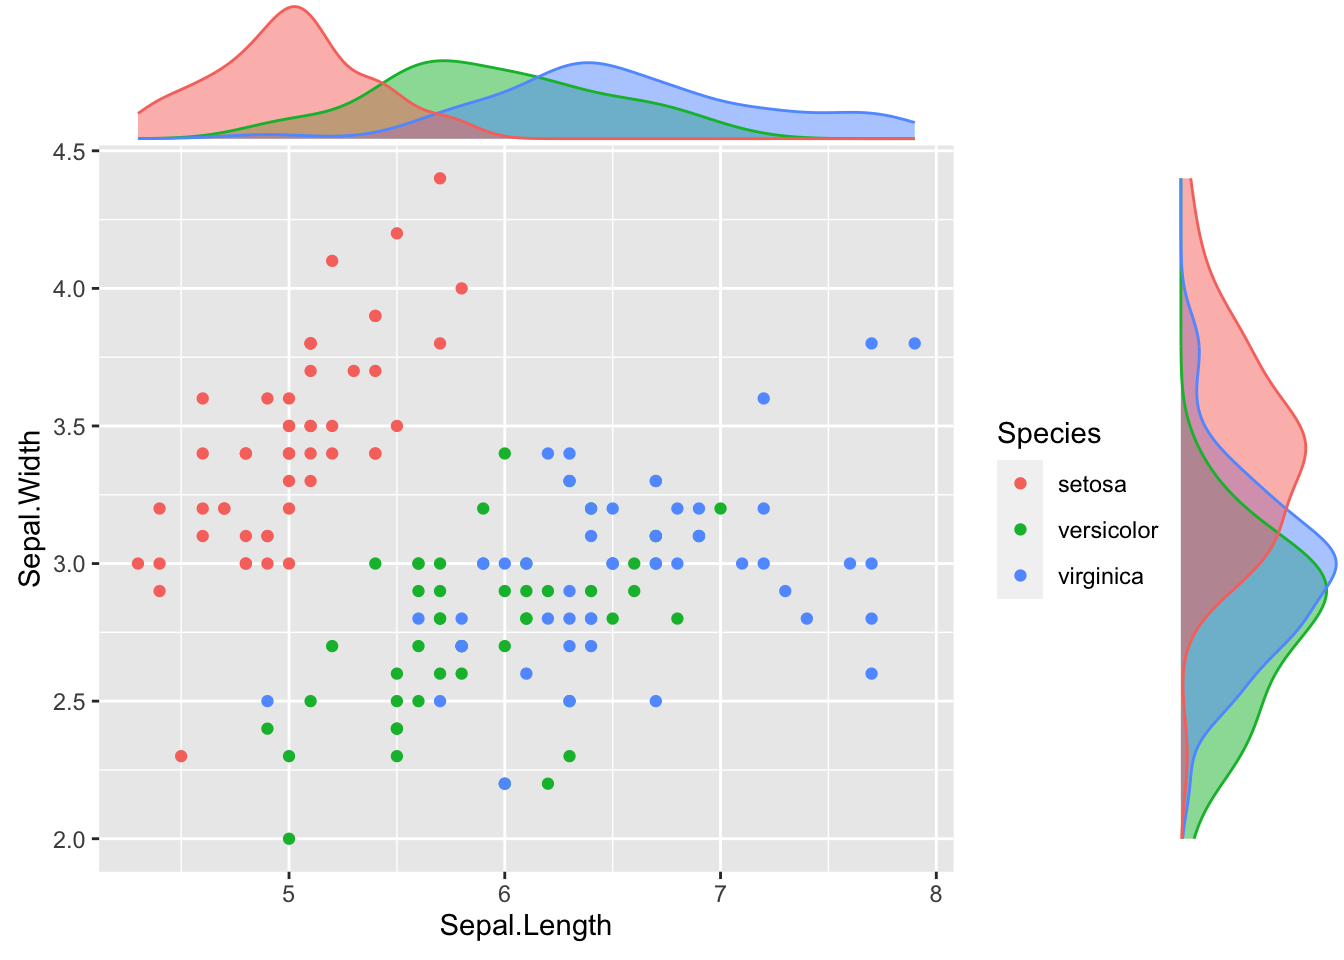
g <- ggplot(iris, aes(x = Sepal.Length, y = Sepal.Width, colour = Species))
g <- g + geom_point()
ggMarginal(
g,
type = "density",
margins = "both",
size = 5,
groupColour = TRUE,
groupFill = TRUE
)