---
title: "グラフ"
author: "Nobukuni Hyakutake"
date: "2023-02-22"
date-format: "iso"
categories: [R,Python]
---

# 目的
RとPythonでグラフ作成をします。
# ヒストグラム
## R
### データの読み込み
```{r}
library(tidyverse)
dgr01<-tibble(value=c(2,2,3,3,3,4,4,5,5,6,6,6,7,7,7,7,7,8,8,8))
```
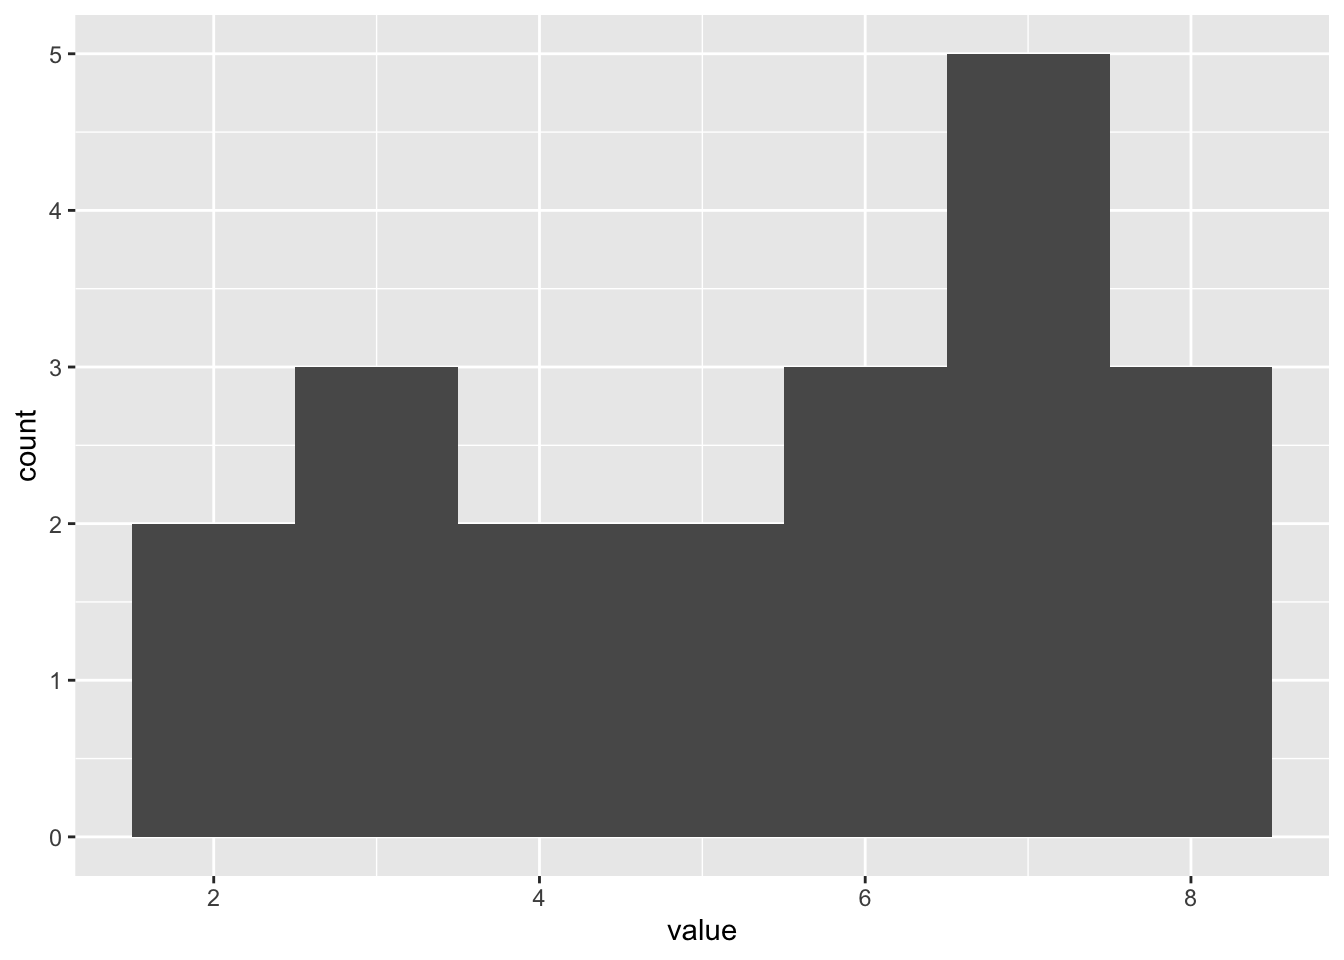
### ヒストグラム
```{r}
ggplot(dgr01,aes(value))+
  geom_histogram(binwidth = 1)
```
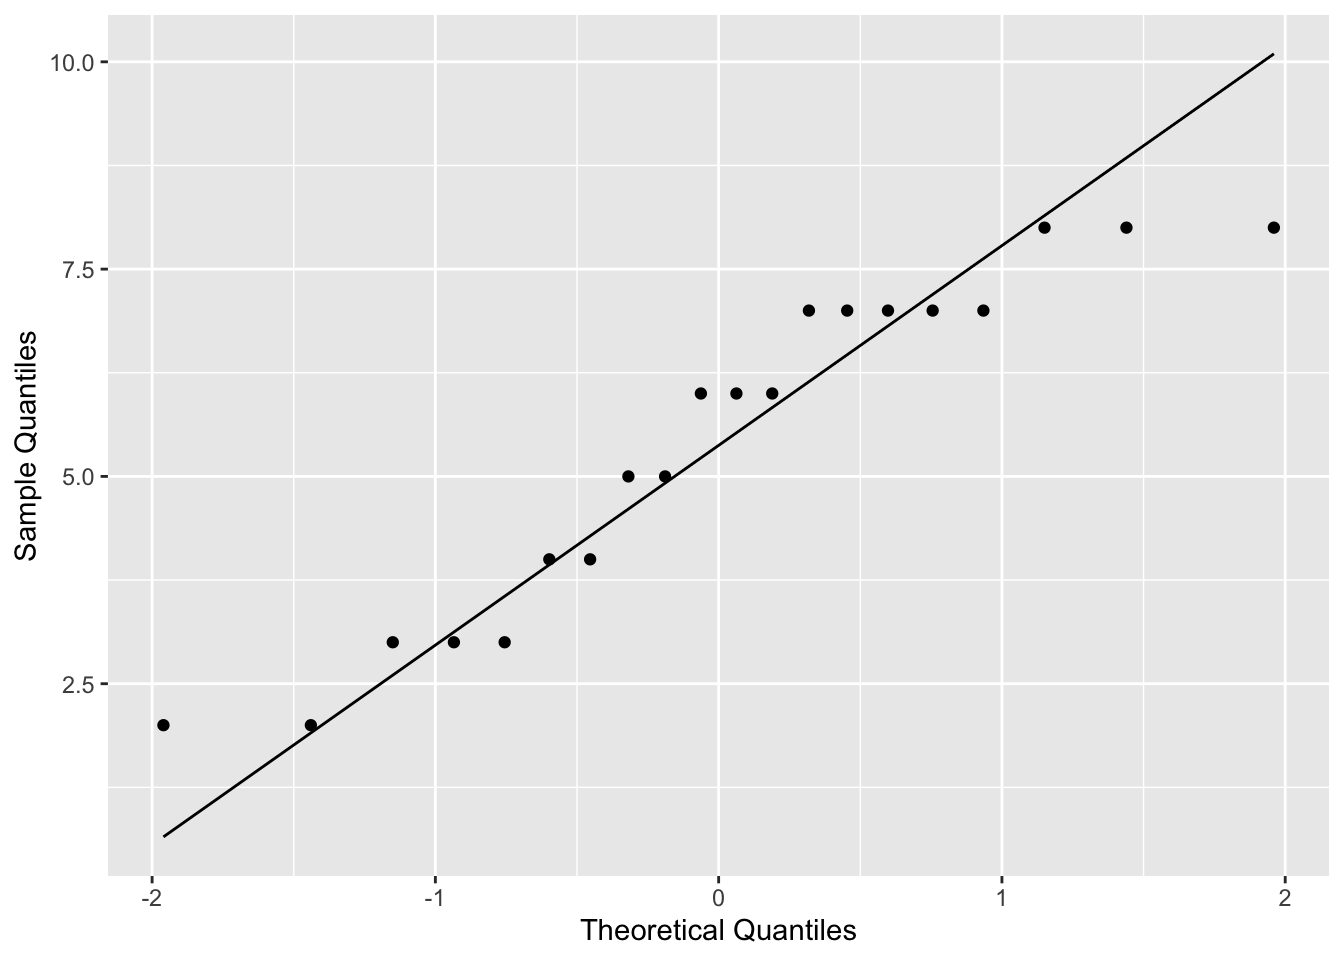
### QQプロット
```{r}
ggplot(dgr01,aes(sample=value))+
  stat_qq()+
  stat_qq_line()+
  labs(x = "Theoretical Quantiles", y = "Sample Quantiles")
```
```{r}
qqnorm(dgr01$value)
qqline(dgr01$value)
```
## Python
### データの読み込み
```{python}
import numpy as np
import matplotlib.pyplot as plt
import statsmodels.api as sm
dgp01=np.array([2,2,3,3,3,4,4,5,5,6,6,6,7,7,7,7,7,8,8,8])
counts,bins=np.histogram(dgp01,
bins=int(max(dgp01)-min(dgp01)+1),
range=(min(dgp01)-0.5,max(dgp01)+0.5))
```
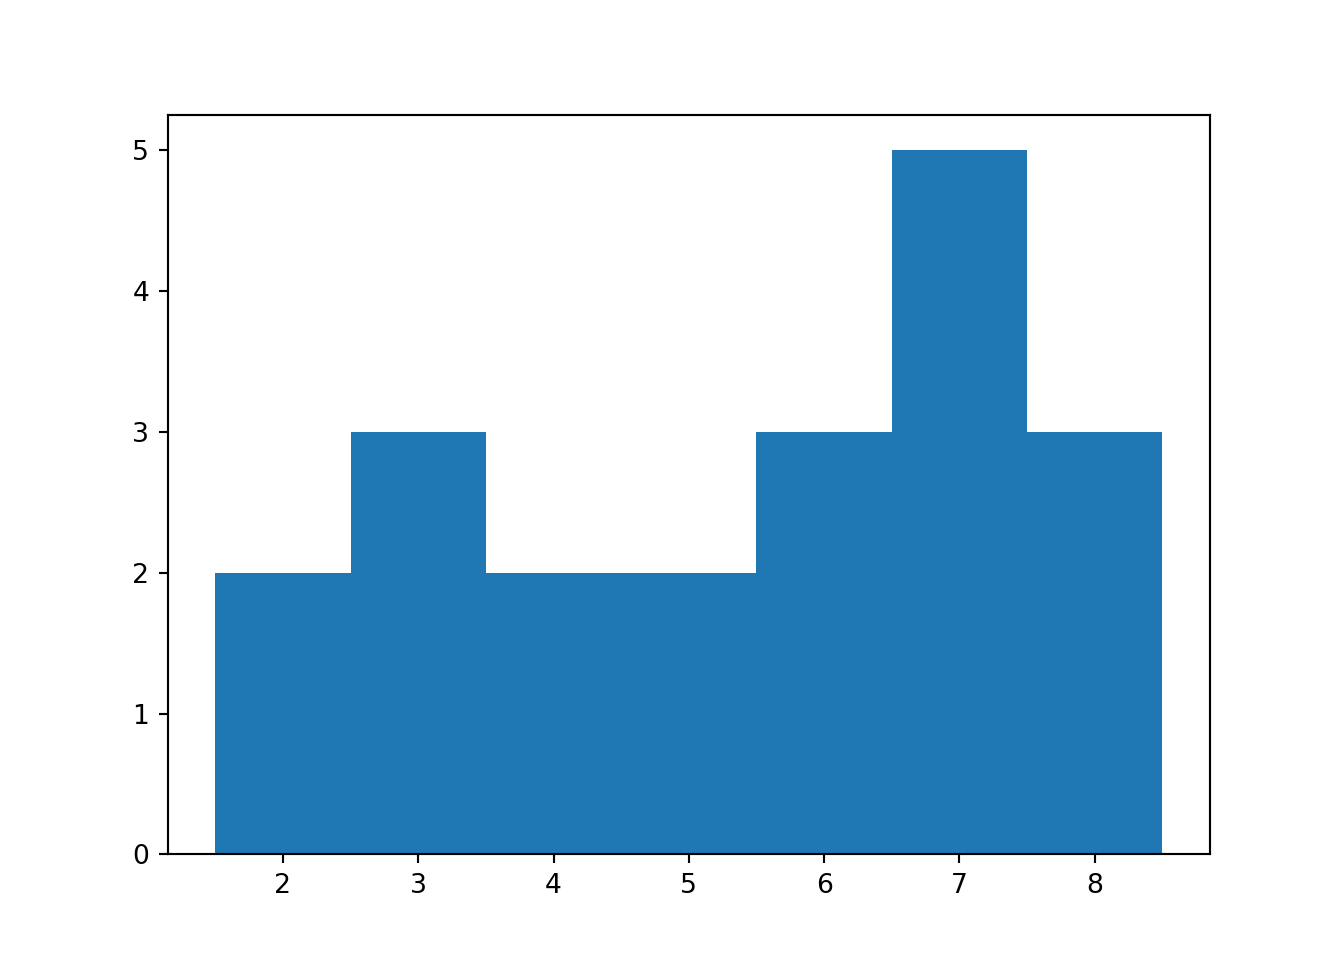
### ヒストグラム
```{python}
plt.stairs(counts,bins,fill=True)
plt.show()
plt.clf()
```
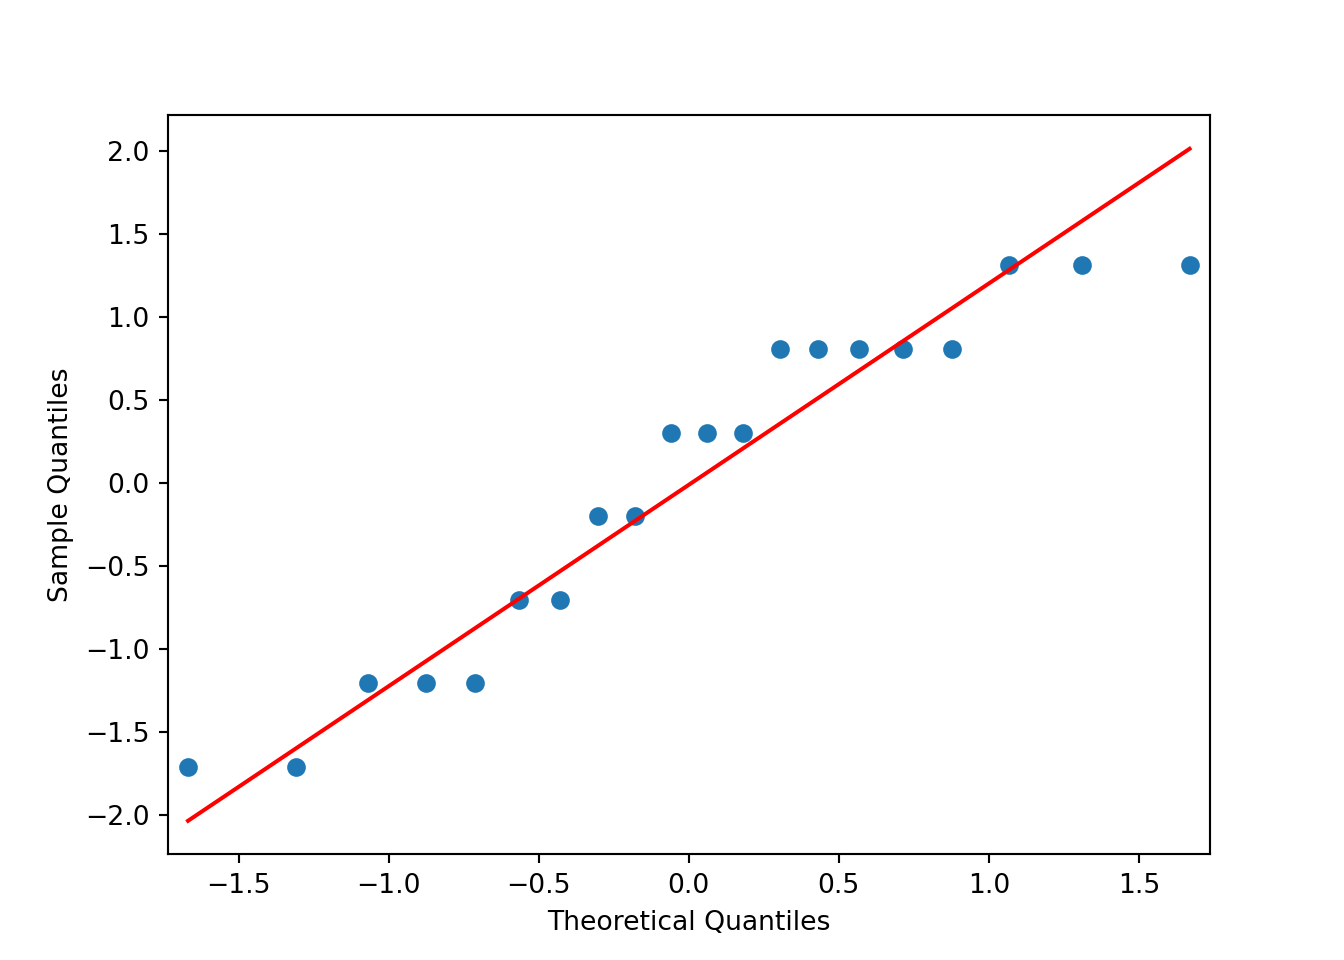
### QQプロット
```{python}
sm.qqplot(dgp01,fit=True,line='q')
plt.show()
plt.clf()
```
# 参考書籍
- [Pythonデータサイエンスハンドブック](https://www.oreilly.co.jp/books/9784873118413/)
- [正規性の検定 共立出版](https://www.kyoritsu-pub.co.jp/book/b10003193.html)
# 参考ウェブサイト
- [ggplot2 - Histograms and frequency polygons](https://ggplot2.tidyverse.org/reference/geom_histogram.html)
- [ggplot2- A quantile-quantile plot](https://ggplot2.tidyverse.org/reference/geom_qq.html)
- [QQプロット](https://k-metrics.netlify.app/post/2018-09/qqplot/)
- [Pythonプログラミング入門 (東京大学 数理・情報教育研究センター)](https://utokyo-ipp.github.io/index.html)
- [matplotlib 初期化](https://nakazakimasahito.wordpress.com/)
- [numpy.histogram](https://numpy.org/doc/stable/reference/generated/numpy.histogram.html)
- [matplotlib.pyplot.stairs](https://matplotlib.org/stable/api/_as_gen/matplotlib.pyplot.stairs.html)