# import altair with an abbreviated aliasimport altair as alt# load a sample dataset as a pandas DataFramefrom vega_datasets import datacars = data.cars()cars
                          Name  Miles_per_Gallon  ...       Year  Origin
0    chevrolet chevelle malibu              18.0  ... 1970-01-01     USA
1            buick skylark 320              15.0  ... 1970-01-01     USA
2           plymouth satellite              18.0  ... 1970-01-01     USA
3                amc rebel sst              16.0  ... 1970-01-01     USA
4                  ford torino              17.0  ... 1970-01-01     USA
..                         ...               ...  ...        ...     ...
401            ford mustang gl              27.0  ... 1982-01-01     USA
402                  vw pickup              44.0  ... 1982-01-01  Europe
403              dodge rampage              32.0  ... 1982-01-01     USA
404                ford ranger              28.0  ... 1982-01-01     USA
405                 chevy s-10              31.0  ... 1982-01-01     USA

[406 rows x 9 columns]
# make the chartalt.Chart(cars).mark_point().encode( x='Horsepower', y='Miles_per_Gallon', color='Origin',).interactive()
# make the chartalt.Chart(cars).mark_point().encode( x='Horsepower', y='Miles_per_Gallon', color='Origin',)
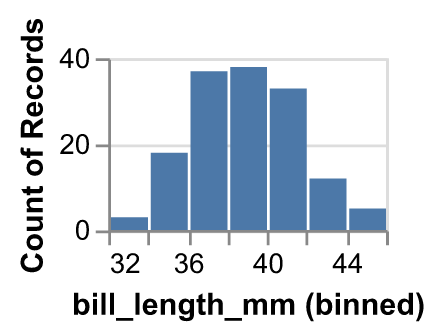
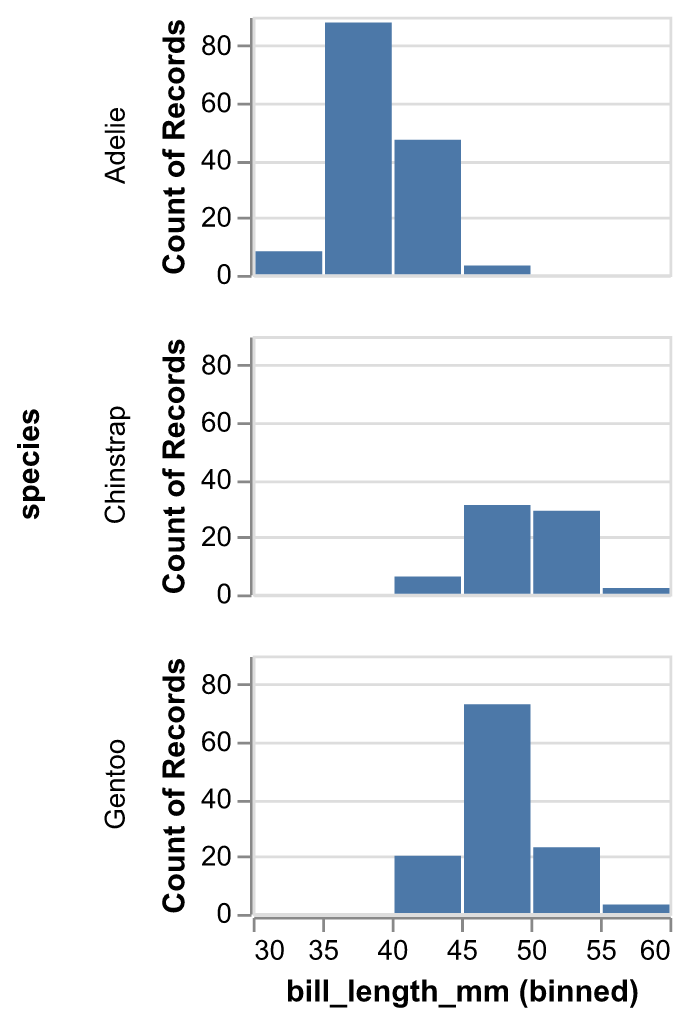
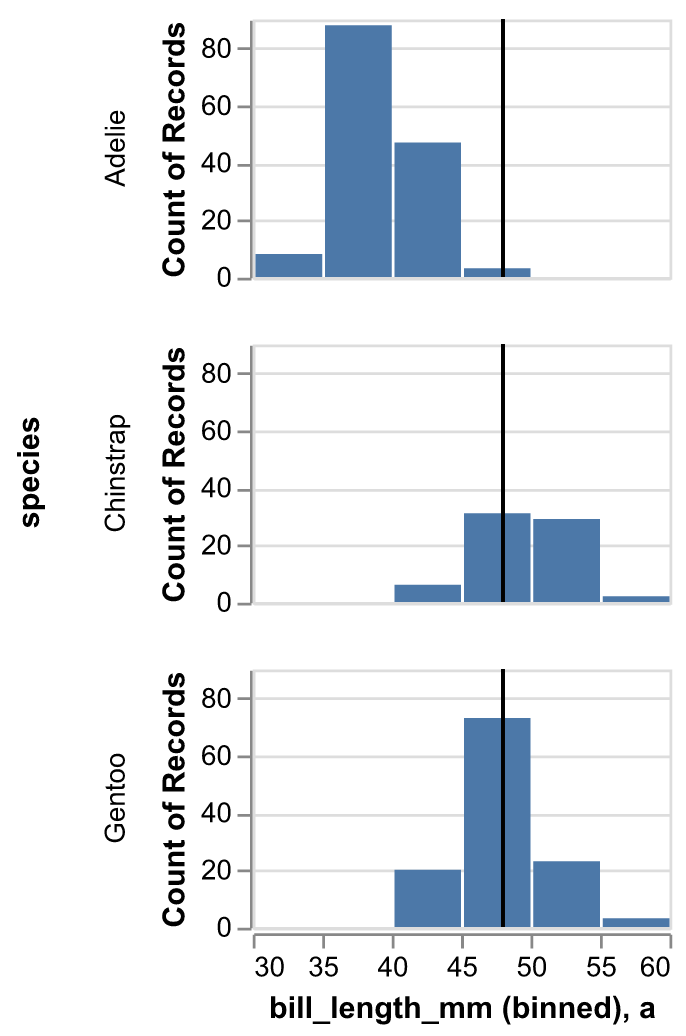
2 ヒストグラム
2.1 Movies
import altair as altfrom vega_datasets import datasource = data.movies.urlsource